Key Points
- Fashion brands must conduct competitive analysis in order to understand their competition, stay relevant, and make educated decisions.
- Data analytics can provide valuable insights for strategic decisions and improve customer satisfaction.
- The blog provides concrete advice for fashion firms to obtain a competitive edge and thrive in the global market, such as competitive pricing, strategic discounting, personalised marketing, and staying up to current on market trends.
Introduction
This article covers the significance of competitive analysis in fashion retail using a case study of Trendy Dazyl Sportiers. It emphasises the use of data analytics to acquire insights from industry titans such as Nike and Adidas, and how this study may help Trendy Dazyl Sportiers improve its marketing strategy and gain a competitive advantage.
Following the analysis, are specific recommendations for Trendy Dazyl Sportiers based on the competitive study.
About Trendy Dazyl Sportiers
Trendy Dazyl Sportiers, a fashion retail brand under the direction of Joe Rocks, seeks to increase its presence in Europe and the United States. To achieve successful growth, Joe recognises the need to gain insights from industry giants like Nike and Adidas.
This article explores the power of data analytics in conducting a comprehensive competitive analysis, enabling Trendy Dazyl Sportiers to position itself for success in the global market.
Before we go into the analysis and the insights, let me briefly explain the competitive analysis and its relevance to a business.
Competitive Analysis
Competitive analysis is a crucial process in the fashion industry that involves evaluating and understanding the strengths and weaknesses of competitors. By gathering and analysing data on their products, pricing, marketing strategies, and customer engagement, fashion brands gain valuable insights into the competitive landscape.
Here’s are 5 reasons competitive analysis is important in the fashion industry:
1. Stay ahead of fashion trends: By examining competitors, fashion brands can spot emerging trends and understand customer preferences. This knowledge helps companies align their designs and collections with the latest fashion movements, ensuring they stay relevant and appealing to customers.
2. Stand out in a crowded market: Understanding the strengths and weaknesses of competitors allows fashion brands to differentiate themselves. By highlighting unique features, design elements, or sustainable practices, they can carve out a distinct brand identity and attract customers who resonate with their values.

3. Make strategic decisions: Competitive analysis provides the necessary information to make informed strategic decisions. Fashion brands can identify untapped market segments, spot gaps in the market, and adjust their product offerings or marketing strategies accordingly. This leads to better positioning in the industry and improved business performance.
4. Refine marketing and sales strategies: Analysing competitors’ marketing and sales approaches helps fashion brands optimise their own strategies. By understanding what works and what doesn’t, they can fine-tune their campaigns, pricing strategies, and customer engagement efforts to increase brand visibility, attract customers, and drive sales.
5. Enhance customer satisfaction: By studying competitors’ customer engagement strategies, fashion brands can gain insights into successful tactics for building customer loyalty and satisfaction. They can identify areas for improvement, personalise their offerings, and deliver exceptional experiences that keep customers coming back for more.
In the dynamic fashion industry, competitive analysis is a game-changer. It empowers fashion brands to stay on top of trends, differentiate themselves, make smart decisions, refine strategies, and create outstanding customer experiences.
By leveraging competitive insights, fashion brands can thrive and succeed in a highly competitive market.
I hope you are clear on what competitor analysis is now. Next, let me walk you through the analysis and insights.
About the Analysis
This Analysis was carried out with Microsoft Excel. It aims to compare some key metrics between Nike and Adidas so Trendy Dazyl Sportiers can make better business decisions.
Here are the business questions Trendy Dazyl Sporties gave that this analysis seeks to answer to keep the company informed.
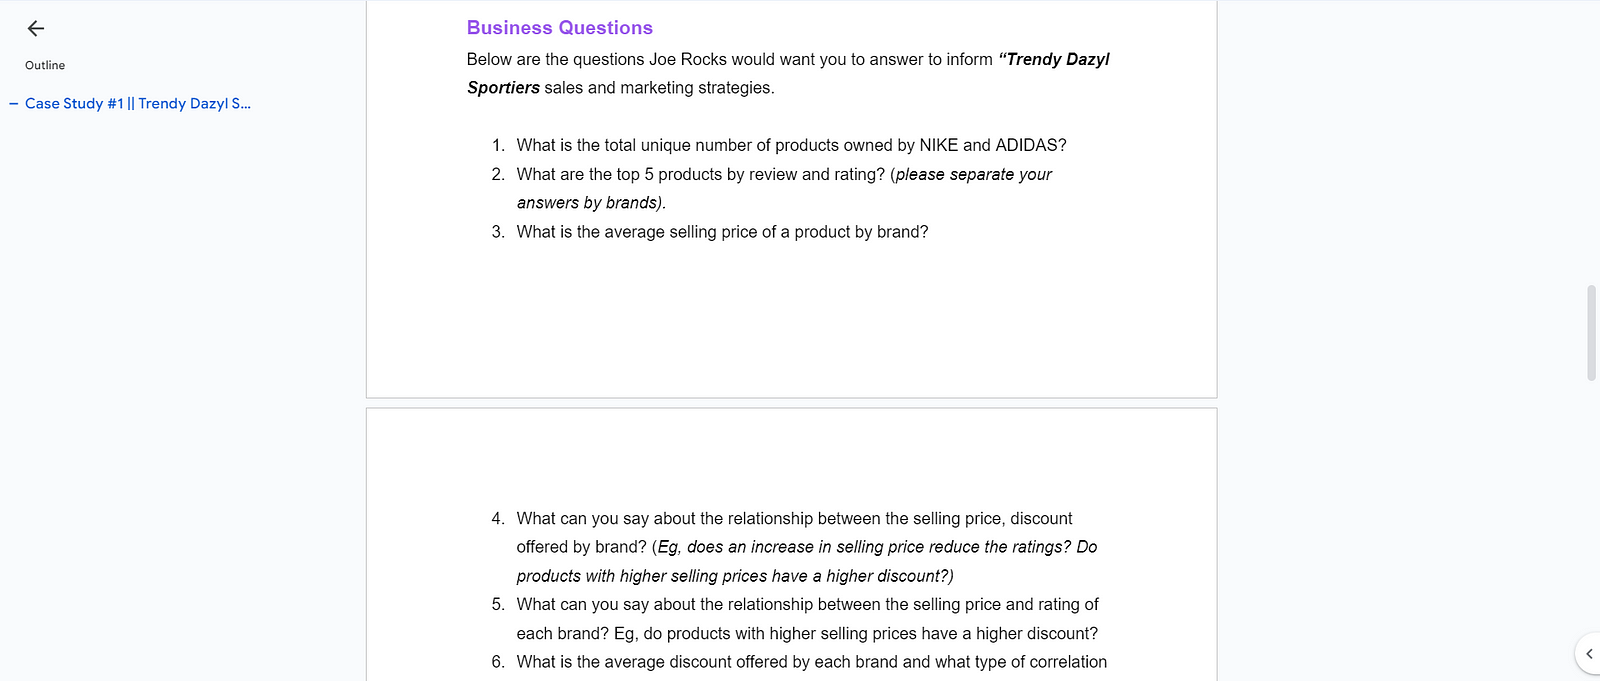
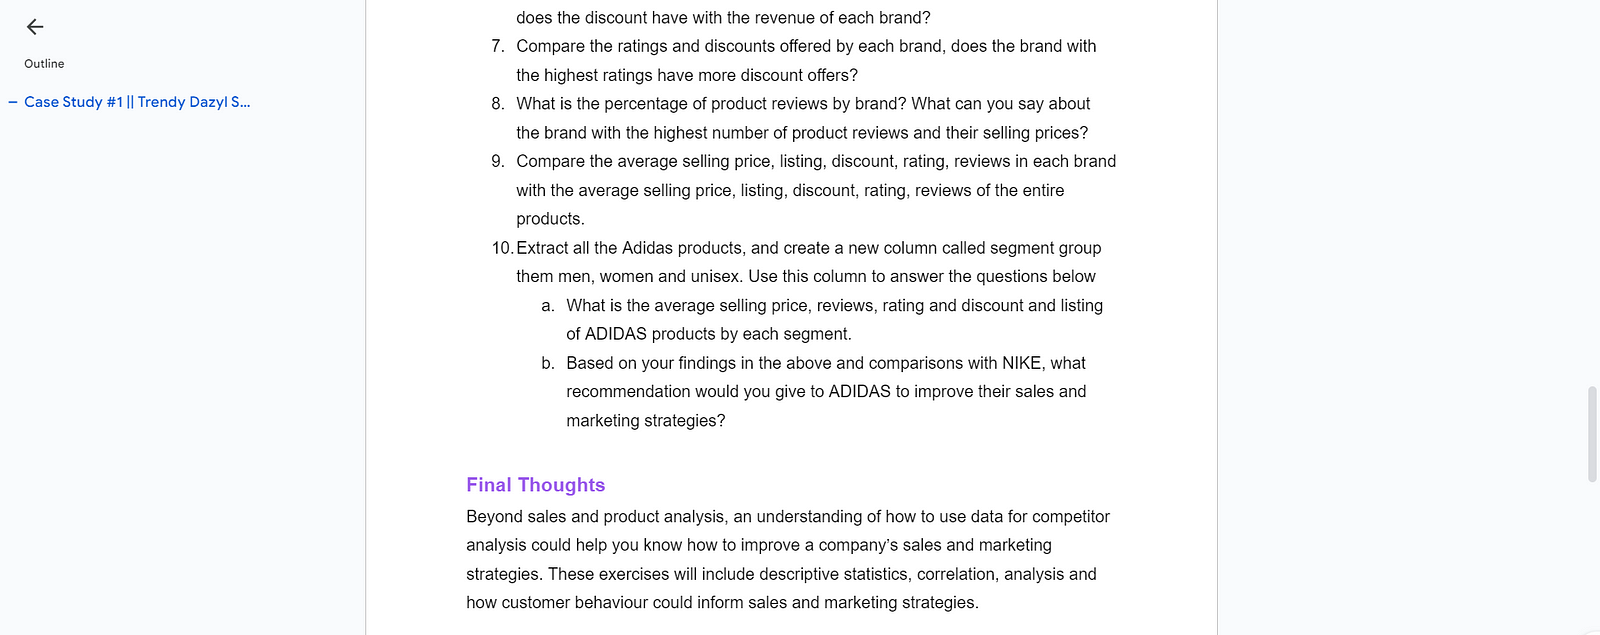
Use case
Beyond product and sales analysis, a competitive analysis that is thoroughly carried out and well understood can be used to improve a company’s sales and marketing strategies, just like Joe Rock is hoping for with these results.
The following Data Analysis process was used to complete this project:
- Data Sourcing:
For this analysis, I utilized a case study provided by DATA4FASHION as part of the 30 Days of Analytics community project series. The dataset, obtained from Kaggle, includes product information for Nike and Adidas.
2. Data Cleaning:
To ensure the data were suitable for analysis, I followed a systematic data-cleaning process. The first step involved identifying the fact table (sales table) and the lookup table (product table).
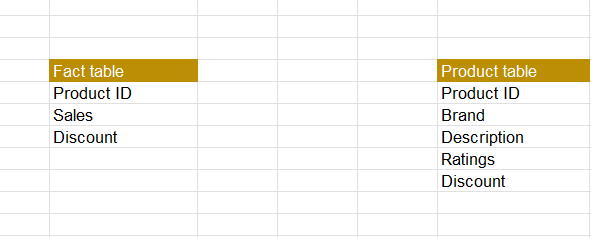
PS: A fact table is a table that holds numerical data representing business transactions or events (e.g sales table), while a lookup table is a table that provides additional descriptive information about the data in the fact table.
Fact tables contain key metrics, and lookup tables contain descriptive attributes.
Afterwards, the unnecessary columns were removed, focusing only on the relevant data required for analysis.
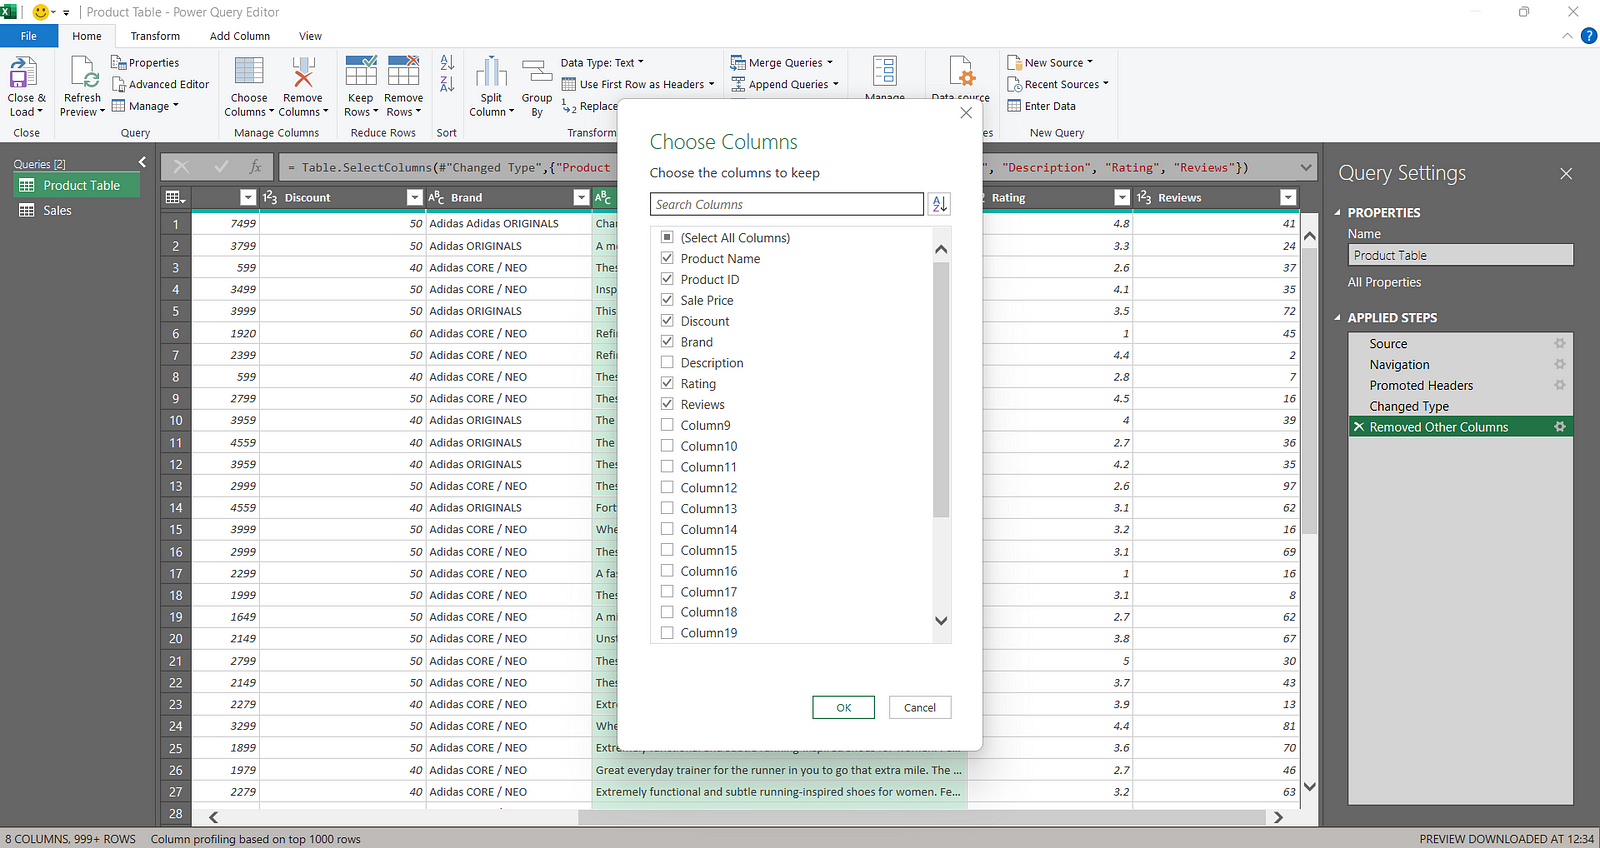
3. Data Exploration and Visualisation:
Data exploration and visualization play a crucial role in uncovering insights and presenting information effectively. I used pivot tables, charts, and graphs to explore the data and answer the following business questions:
Following the data cleaning, the next task was to explore and analyze the data using pivot tables ,charts and finally answering the business questions.
- What are the total unique products produced by Nike and Adidas?
The total unique number of Adidas products is 2625 and 554 for Nike.

2. What are the top five products by reviews and ratings?
Adidas has received 90 product reviews, while Nike has received 41, indicating stronger customer engagement for Adidas.

3. What is the average selling price of a product by brand?
Adidas achieves an average selling price of $5,135, whereas Nike commands a higher average of $9,983.

4. What is the relationship between the discounts offered by brands and their selling prices?
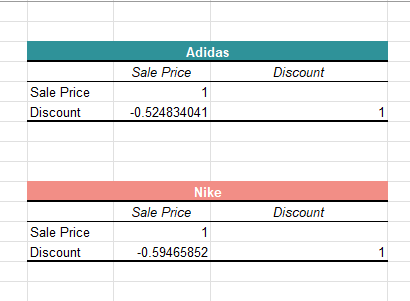
Here, a correlation analysis was done to determine the type of relationship between these variables (selling price and discount offered). The correlation coefficient between these variables returned negative values. -0.53 for Adidas and -0.60 for Nike, approximately.
This implies that there is a moderately negative correlation between the discount and the sales price.
I.e As discount increases, sales price tends to decrease for both companies.
5. Is there a correlation between the selling price and the rating of both brands?
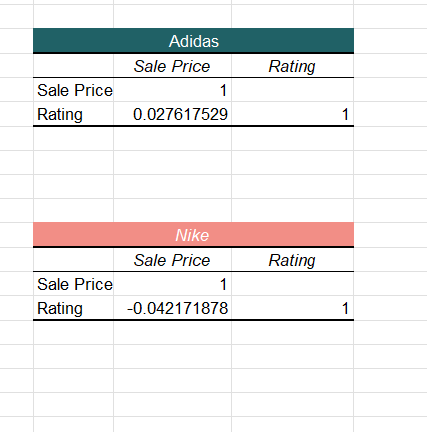
The correlation coefficients between the sales price and rating variables for Adidas and Nike are 0.03 and -0.04, respectively. In other words, Adidas exhibits a positive relationship between ratings and selling prices, while Nike demonstrates a negative correlation.
For Adidas, this means that there is a positive relationship, i.e., as the value of one variable increases (ratings), the value of the other variable (sale price) increases.
6. What is the average discount each brand offers, and how does the revenue of the brands relate to one another?
Revenue is calculated by multiplying the price and quantity of a product. In this dataset, only the sales price is given. So, the sum of the sales prices was used to estimate the revenue.
Both brands show a negative correlation between sales price and discount offers. Implying, as the sales price increases, the discount offer decreases.
7. In a comparison of the ratings between each brand, does the brand with the highest ratings offer more discounts?
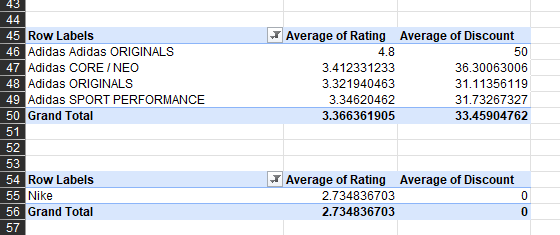
Using a pivot table, it shows that Adidas has a larger product range. And all of these products combined have a higher rating than Nike. Adidas also offers a higher discount than Nike.
Therefore, Adidas, with higher ratings, offers a more substantial discount than Nike.
8. What is the percentage of product reviews by brand?
Adidas has a higher product review than Adidas. The total product review percentage for Adidas is greater than that of Nike. The brand with the highest percentage of reviews has a lower selling or sales price (the average sales of each brand was answered in question 3).
Adidas enjoys a larger share of product reviews compared to Nike, indicating a higher level of customer engagement.

9. Comparison of the average selling price, discount, ratings, and reviews in each brand with the average seeking product of the entire product
The average selling price and average discount offered for the entire product are approximately $20,046,780 and 26.88%, respectively. On the other hand, the average rating for the entire product is 3.2.
Of all these parameters, Adidas takes a large share of each of them, for example. Because Nike doesn’t offer a discount, the average discount for the entire product is 26.88%, the same as the Adidas discount.
Adidas takes a large share of calculation parameters and aligns closely with the averages, while Nike deviates due to the absence of discounts.

First, all Adidas products were extracted to create a new column. Then these columns were separated to get the different brands. These segments are Men, women, and unisex.
Each segment was extracted along with its sales price, discount, rating, reviews, and product name using an Excel function called Vlookup.
Men’s Segment :
- The average sale price for the men’s segment is $4,920
- The average discount is 34.10%
- The average rating is 3.36
- The average review is 48.62

#Women’s Segment :
- The sale price for the women’s segment is $5,315;
- The average discount is 33.04%
- The average rating is 3.39
- The average review is 49.09

Unisex’s Segment :
- The sale price for the Unisex segment is $7,536
- The average discount is 25.35
- The average rating is 3.40
- The average product review is 48.07

Visualising each data point and bringing it all together to create this final dashboard.
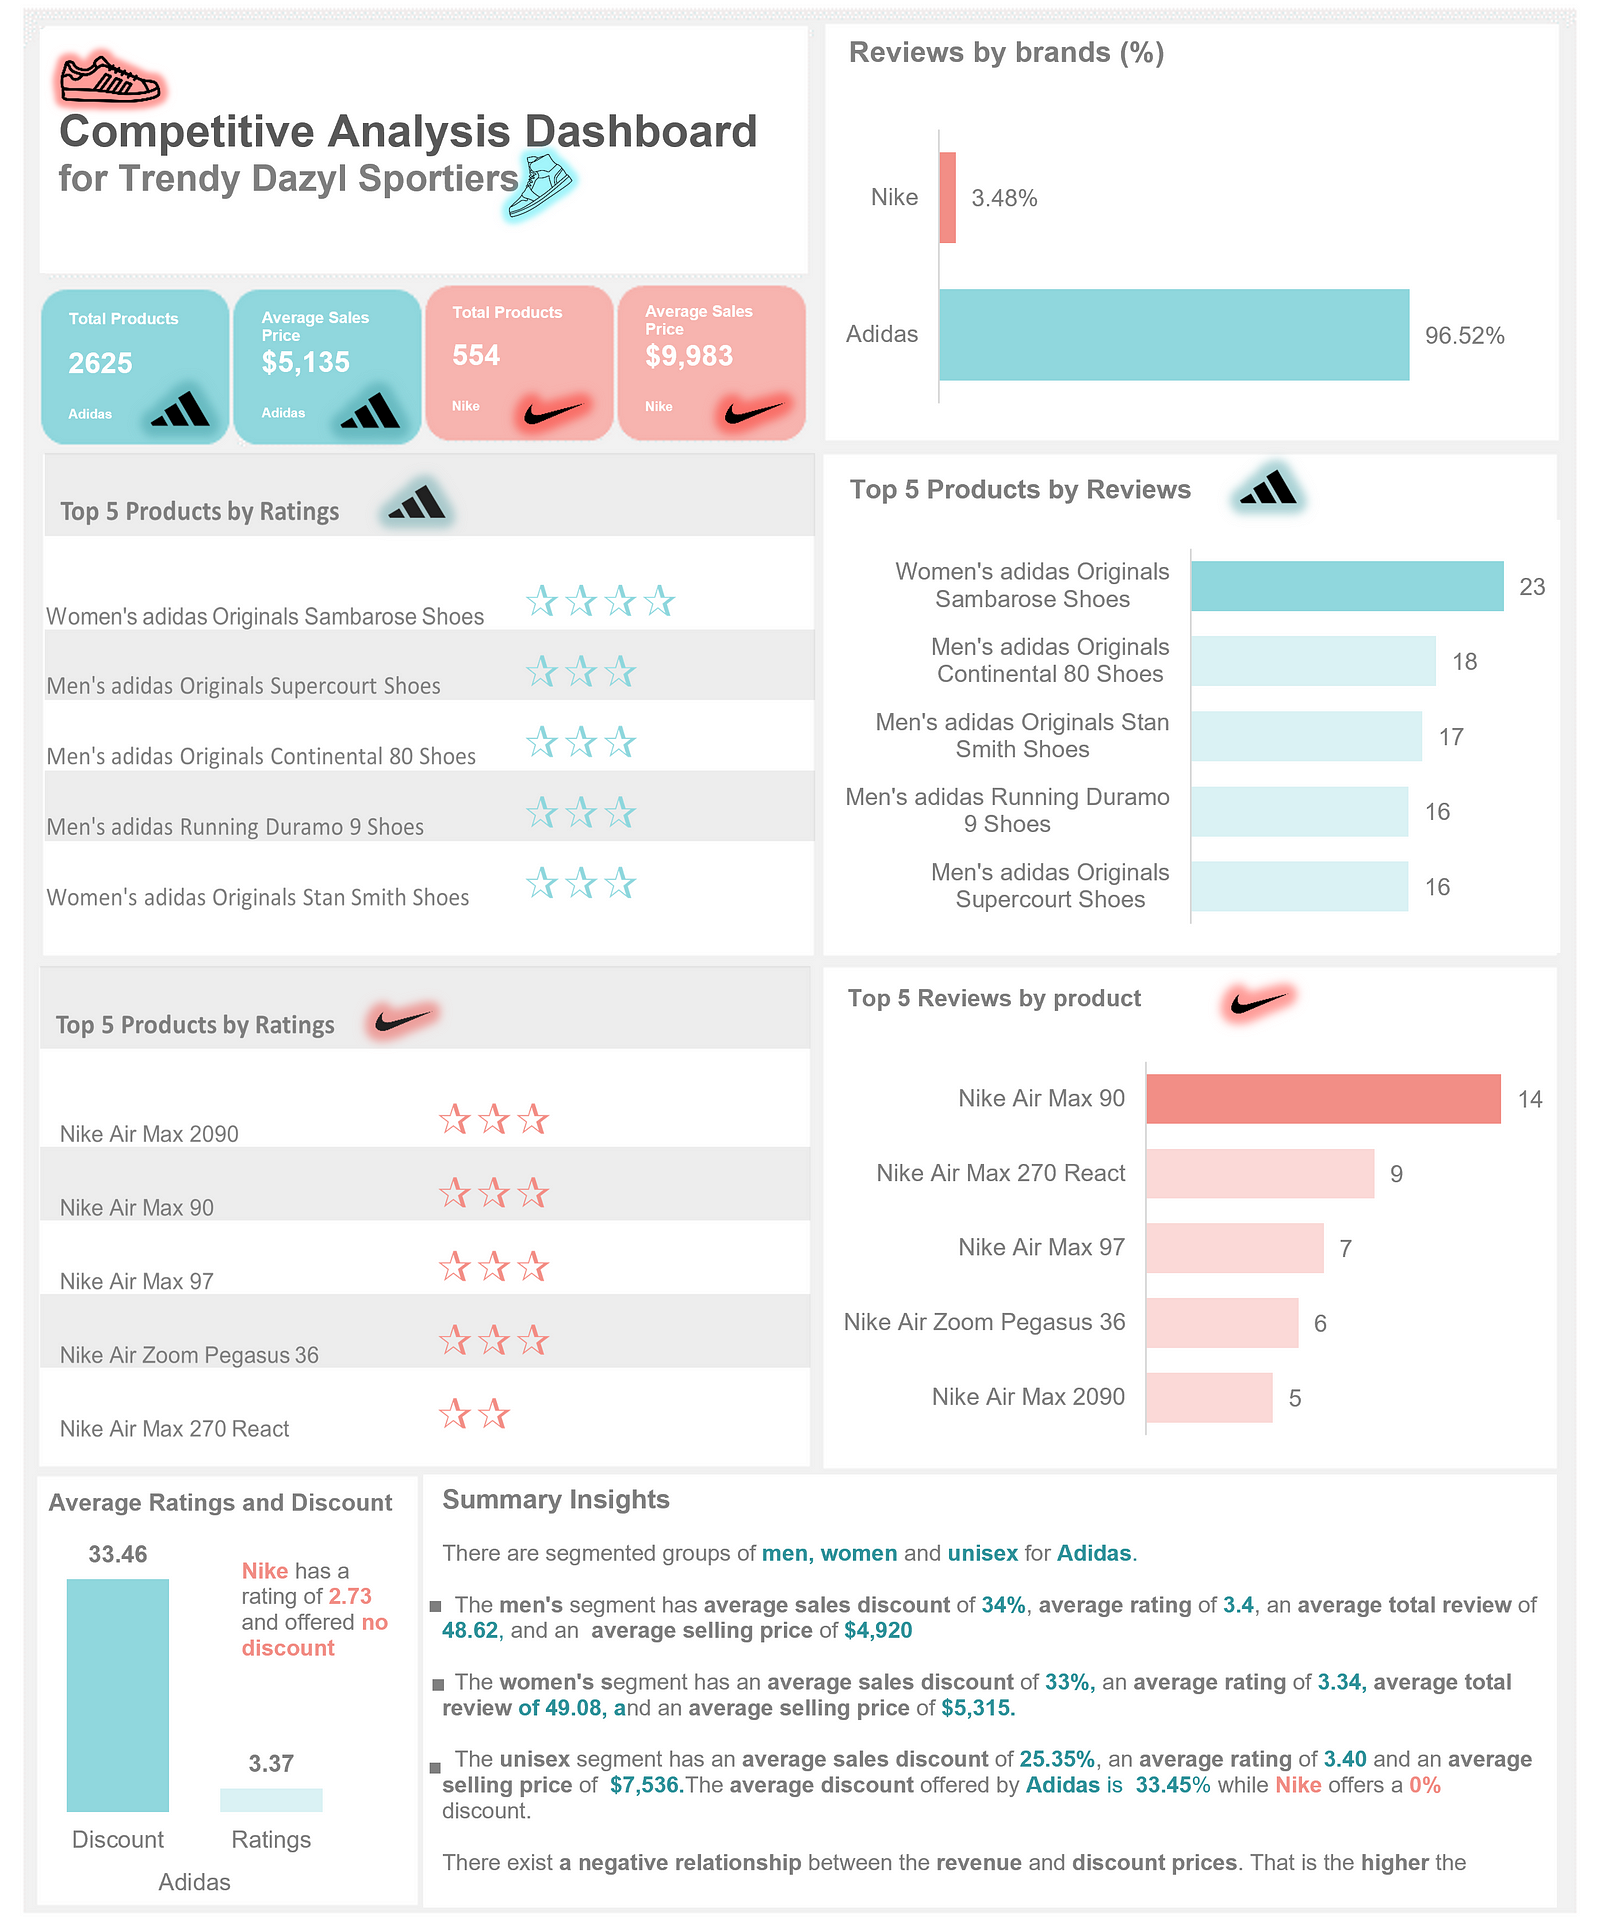
Based on the analysis findings, the following key insights emerge:
- Adidas outperforms Nike in terms of product range, ratings, and customer reviews.
- Adidas offers discounts to customers, while Nike does not.
- Adidas segments its products into men’s, women’s, and unisex categories.
- Nike maintains higher selling prices compared to Adidas.
Recommendation
Drawing from the insights obtained through the competitive analysis, Trendy Dazyl Sportiers can leverage the findings to enhance their marketing strategies and gain a competitive edge.
Here are some specific recommendations for Joe:
- Emphasize Competitive Pricing:
To compete effectively with industry giants like Nike and Adidas, Trendy Dazyl Sportiers should prioritize offering competitive pricing.
Conducting a thorough analysis of production costs, competitor pricing strategies, and market demand would help to determine optimal price points that provide value to customers while ensuring profitability.
Also, aligning pricing with Adidas’ strategy of targeting multiple customer segments and offering each segment the appropriate products and prices.
2. Develop a Discount Strategy:
While discounts can impact sales, it’s essential to leverage them strategically. Instead of widespread, ongoing discounts, consider implementing targeted promotional offers or limited-time sales events.
This creates a sense of urgency and drives customer engagement. Therefore, a focus on specific product lines or customer segments would help Joe to maximize the impact of discounts.
In addition, there should be an emphasis on the value proposition of Trendy Dazyl Sportiers’ products, highlighting unique design elements, technological advancements, or sustainable materials.
3. Implement Targeted Marketing Campaigns:
Design marketing campaigns that cater to specific customer segments, rather than employing a one-size-fits-all approach.
It is necessary to analyze the characteristics and preferences of each segment and create tailored messaging and offers that resonate with their needs. Also, using various marketing channels, such as social media, email marketing, and influencers, to reach the target audience effectively.
4. Enhance Customer Engagement:
Joe should take inspiration from Adidas’ successful customer review strategies and implement similar tactics. Encourage customers to provide reviews and testimonials by offering incentives or creating a seamless feedback process.
This customer reviews and testimonials could be used to build social proof and influence potential customers’ purchasing decisions.
5. Monitor Market Trends and Customer Preferences:
Staying vigilant in monitoring market trends, competitor strategies, and evolving customer preferences in the sportswear industry cannot be overemphasized.
In other words, a regular update of the competitive analysis is necessary to stay informed about the latest developments and adjust marketing strategies accordingly. In addition, conducting customer surveys, and focus groups, or engaging in social listening to gain real-time insights into customer’s needs and preferences.
This proactive approach will help Trendy Dazyl Sportiers stay ahead of the competition and adapt quickly to changing market dynamics.
In Conclusion
By implementing these recommendations, Trendy Dazyl Sportiers can enhance their marketing strategies, optimise pricing, and engage customers effectively. These steps will help the company establish a competitive edge in the fashion retail industry and drive growth in the global market.
About the Author
Zainab Kareem works as a Data Analyst and Team Lead for the Content Writing Team at DATA4FASHION.
She writes about data analytics applications in fashion, given that she has an immense passion for fashion.
Connect with her on LinkedIn.
For inquiries on how to contribute to our fashion data blog, email us at info@data4fashion.org.


